Victor Camargo
06/08/2021
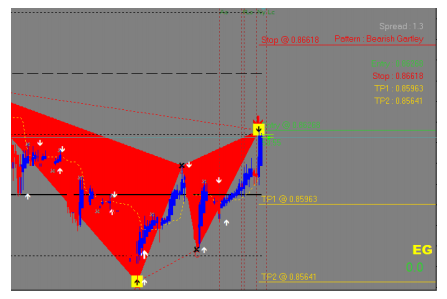
The Gartley harmonic pattern was originally published by HM Gartley in his book “ Profitsin the Stock Market ”. After that, Fibonacci levels were added by Scott Carney,in his book The Harmonic Trader and these are the levels mentioned here. in a bullishpattern, for example, the pattern appears early in a trend and is a sign that acorrection wave is ending and bull movement may appear after pointD. Point B is a 0.618 retraction of XA. C is a retraction between 0.382 and 0.886 of AB.Finally, D is an extension between 1.13 and 1.618 of AB, as well as a retraction of 0.786 ofSHAH. D is called the Potential Reversal Zone
Source:https://wintrademarkets.com/
